Overview
WaferLens answers one question a yield engineer asks every week: yield dropped, so which tool or chamber caused it, how early could we have known, and what does it look like on the wafer?
It is built around a simulated fab that logs everything it injects: step shifts, drifts, chamber offsets, recipe changes and spatial defect patterns, each with its chamber, start and end. That ground truth is the point. Every detector in the project is scored against it, next to a chance baseline, so the results say how well each method works rather than how plausible it looks.
This is version 2. Version 1 was a 500-wafer Streamlit demo and lives on the waferlens-v1-archive branch.
Architecture
- Fab simulator: products, routes, tools and chambers with wafer-level genealogy, sensor and metrology readings, sort maps from a Poisson defect model, and a ground-truth log of every injected excursion. The demo fab holds 25,000 wafers in 1,018 lots (4.8M rows); a stress profile scales to 125,000 wafers (24M rows).
- Warehouse: PostgreSQL 16 with TimescaleDB hypertables, Alembic migrations, an atomic COPY loader guarded by data contracts.
- dbt: a star schema (facts at a stated grain, shared dimensions) for reporting, with tests on every model.
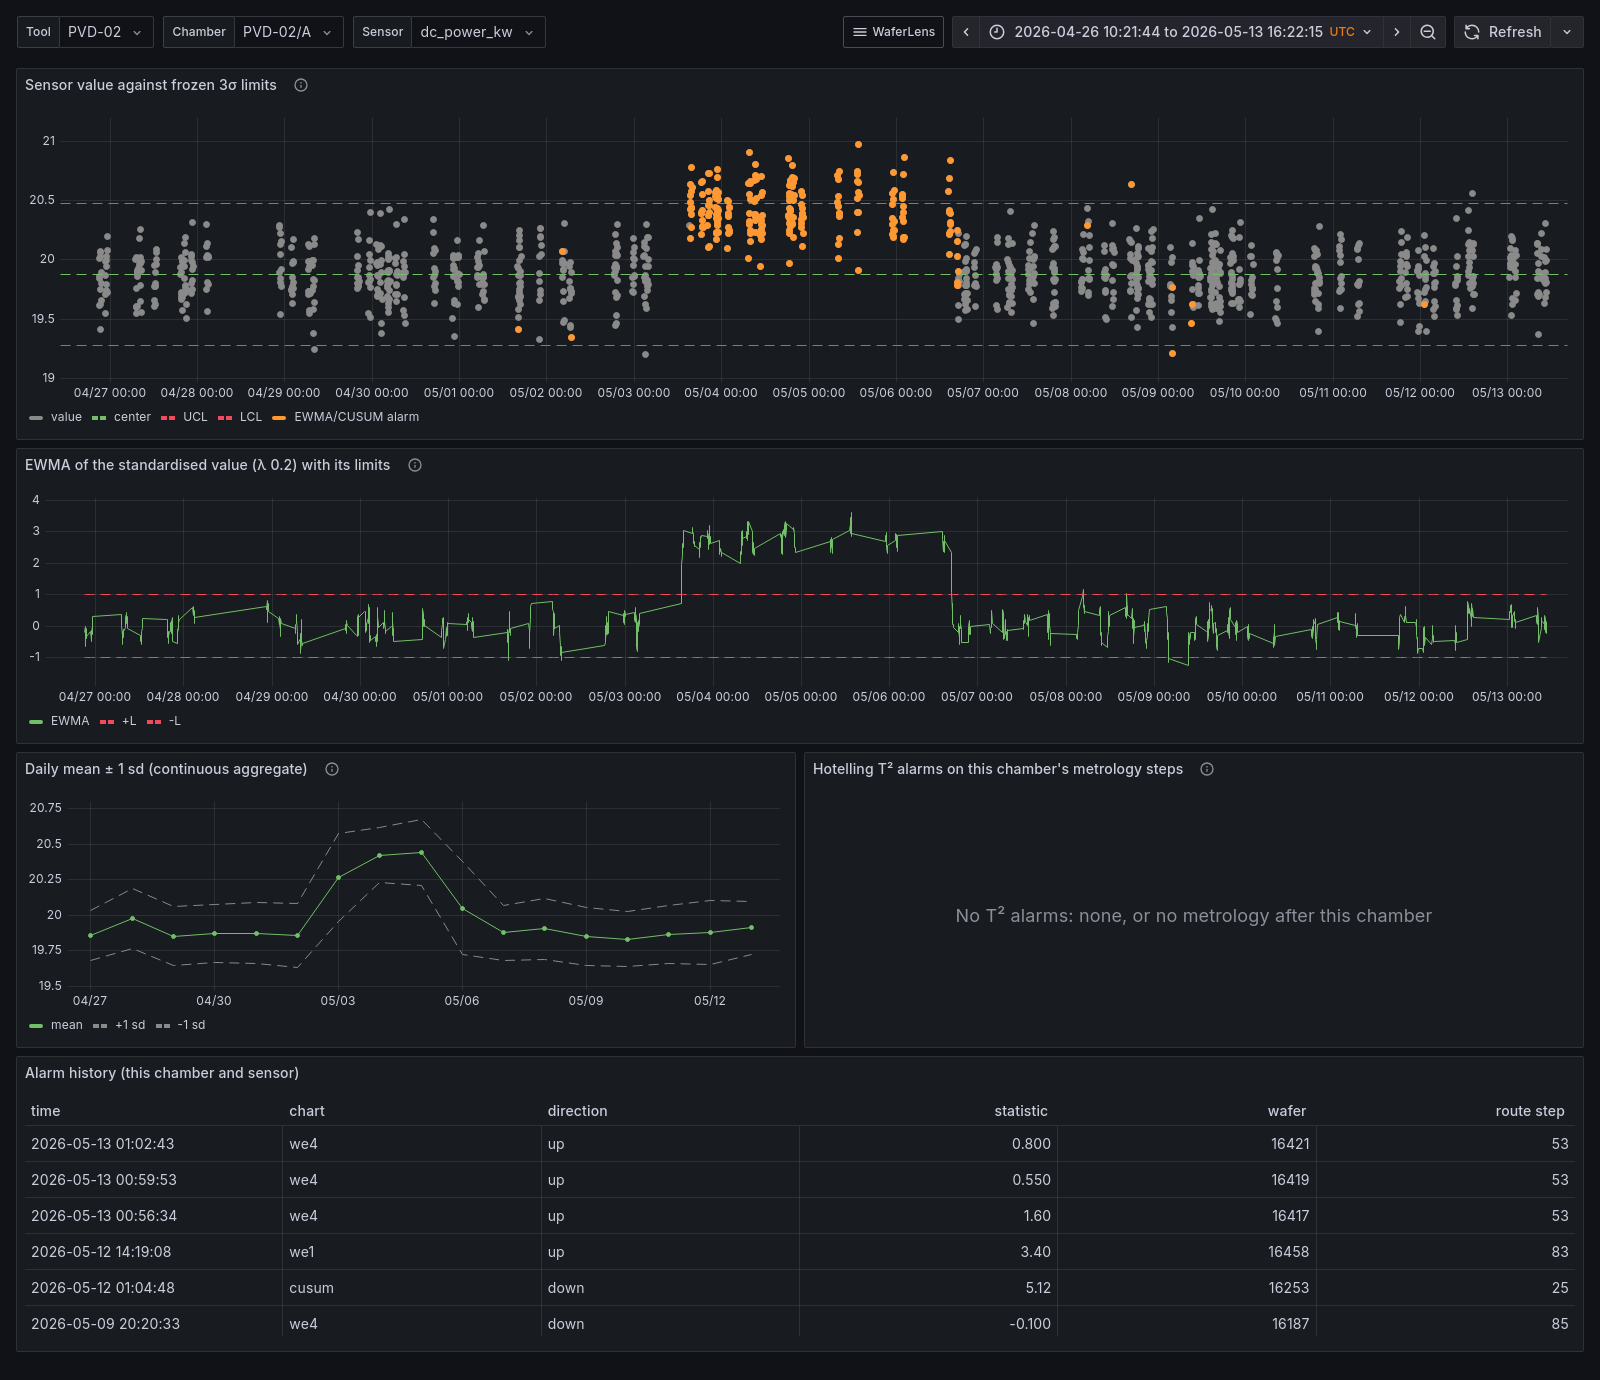
- Analytics: SPC (Western Electric rules, EWMA, CUSUM, Hotelling T²) with frozen Phase I limits; commonality root cause in SQL; impact per excursion.
- Wafer-map patterns: every sorted wafer classified by FabEye through its API, never retrained here.
- Process ML: fail prediction on the real UCI SECOM dataset, tracked in MLflow.
- Real-time SPC: tool agents publish events to Redpanda (Kafka API); a consumer keeps EWMA/CUSUM state per chamber.
- Serving: Grafana dashboards and alerts provisioned from git, Prometheus for FabEye, and a Power BI report on the marts, version-controlled as PBIP.
- Orchestration: Dagster runs the whole pipeline as assets; CI runs 280+ tests on every pull request.
Results
How early SPC catches a shift
Average number of points until the first alarm, from 2,000 simulated runs per cell (0σ = points between false alarms; within 3% of the published tables):
| Chart | 0σ | 0.5σ | 1σ | 2σ | 3σ |
|---|---|---|---|---|---|
| Shewhart | 367 | 157 | 44 | 6.3 | 2.0 |
| Western Electric 1–4 | 91 | 28 | 9.6 | 3.5 | 1.8 |
| EWMA (λ 0.2) | 542 | 42 | 10.1 | 3.0 | 1.6 |
| CUSUM (k 0.5, h 5) | 475 | 38 | 10.6 | 4.0 | 2.5 |
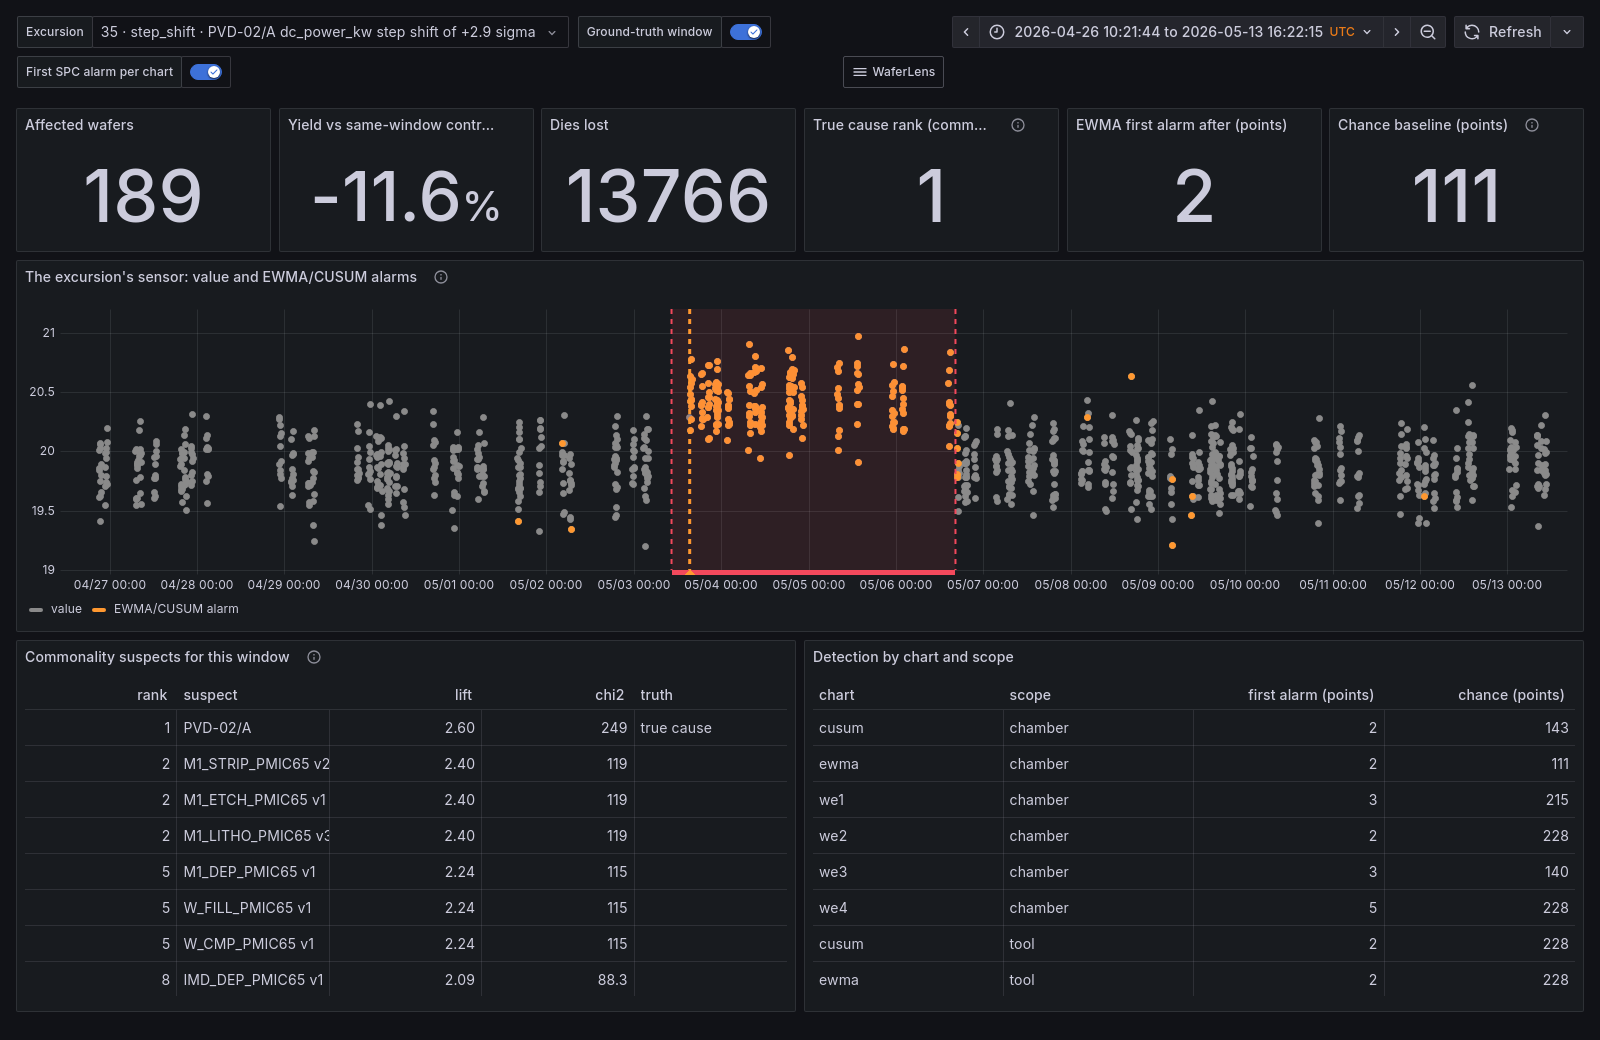
On the fab's own excursions, chamber-level EWMA and CUSUM alarmed after a median of 8–9 affected wafers against 33 for Shewhart, with a chance baseline of 140–200.
Which chamber caused it
Given only an excursion's time window, commonality analysis ranks every chamber and recipe version by how over-represented it is among the low-yield wafers. It named the true cause first for 23 of 32 excursions that cost yield (72%), against 0.8% for a random pick among ~129 suspects.
Spatial defect patterns are invisible to SPC because no sensor moves. Starting from the pattern FabEye sees on the wafers, commonality named the right chamber first for 13 of 13 spatial excursions, and a pattern alarm on sorted wafers caught all 13 (SPC: 0), a median 52 hours after the excursion began, almost all of it the time wafers take to reach sort. One idea failed and is reported as such: guessing the pattern from the time window dropped top-1 accuracy from 72% to 47%, because overlapping excursions put some pattern in almost every window.
Real-time SPC
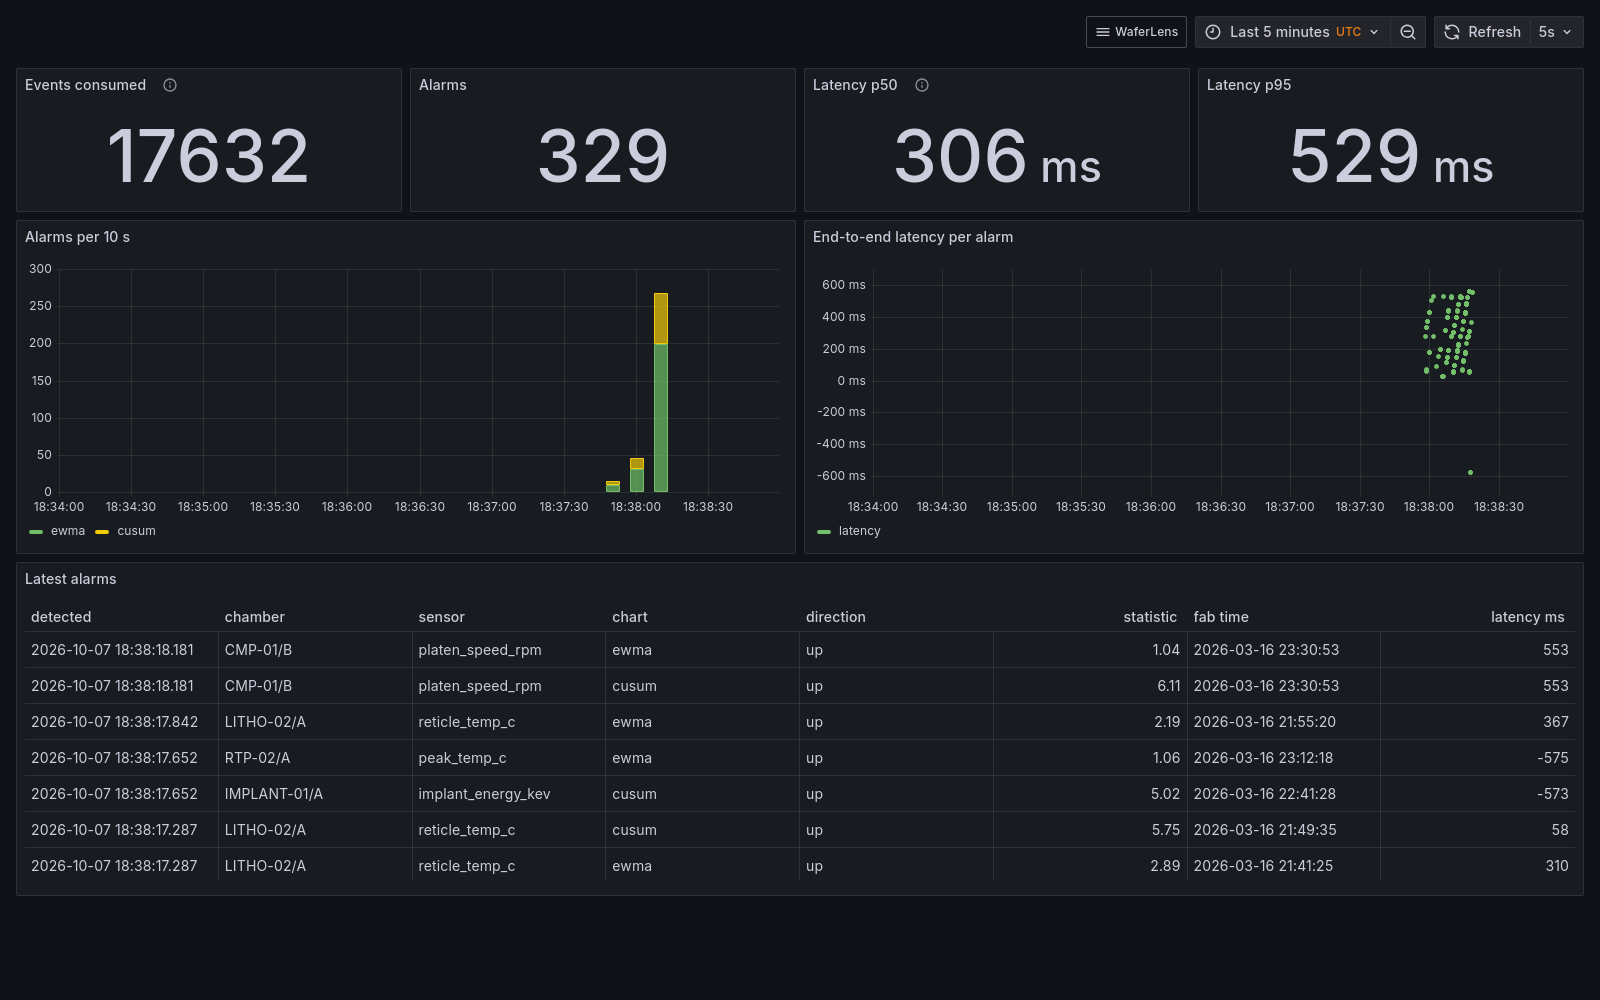
A day of the fab (17,632 events) replayed through Redpanda with a +2σ step injected on one chamber: caught after 3 points, about 270 ms (median) from event to alarm. Alarms, chart state and Kafka offsets commit in one Postgres transaction, so a crash or a replay can neither lose nor duplicate an alarm, and on the dev fab the stream raises exactly the batch engine's alarms.
Fail prediction on real fab data (UCI SECOM)
590 anonymised sensors, 1,567 runs, a fail rate drifting from 22% to 3% in three months. Trained on the first 70% of runs and scored once on the last 30%:
| Time-ordered holdout | Same model, random split | |
|---|---|---|
| LightGBM (chosen by walk-forward CV) | 0.065 PR-AUC | 0.177 |
| Chance (holdout fail rate) | 0.055 |
Forward in time the sensors barely predict fails, and a random split, the evaluation most published SECOM results use, overstates the model 2.7x. That gap is the finding.
Wafer-map patterns on a different fab
FabEye was trained on real WM-811K lots. On 24,090 simulated wafers it reached macro-F1 0.909, but its 90% prediction sets covered the strong "random" defect fields only 52% of the time: they look like WM-811K's Near-full. The overall score flatters it, since simulated patterns are cleaner than real ones; the useful result is where its guarantees break.
Power BI report
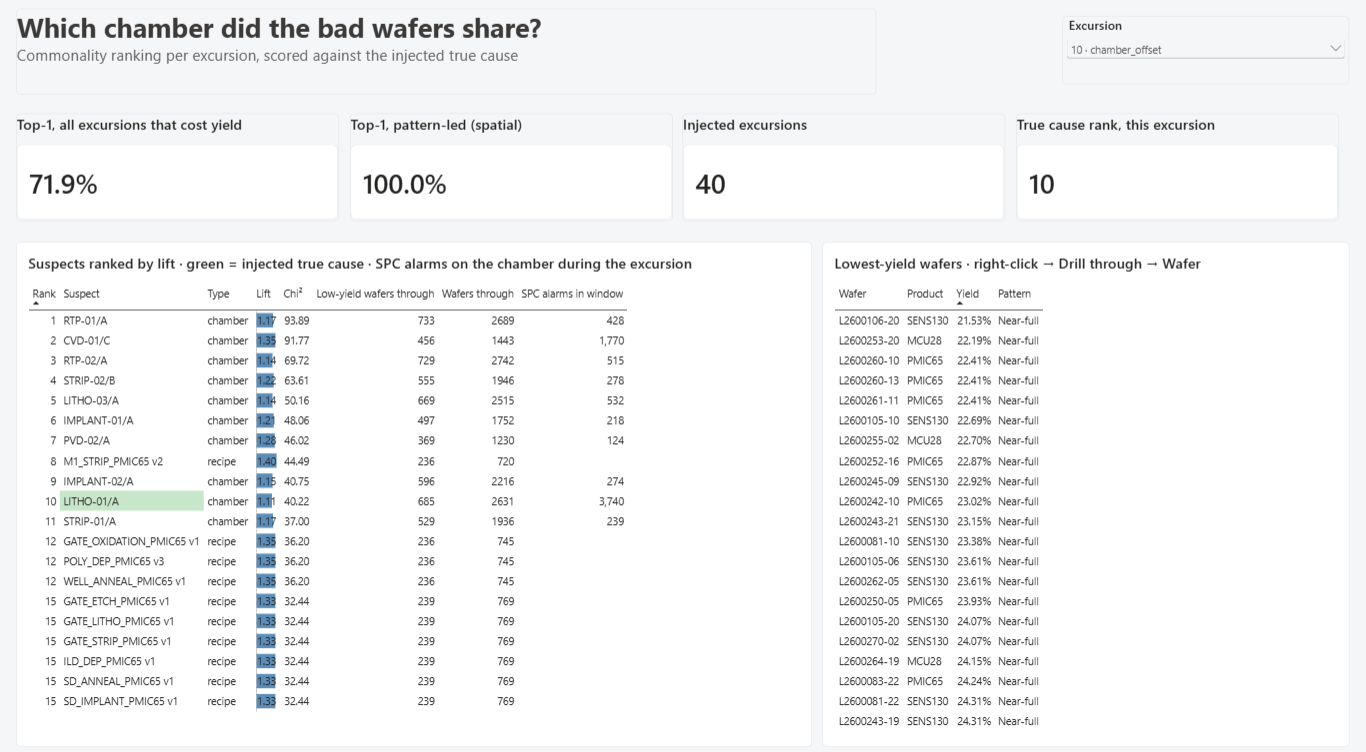
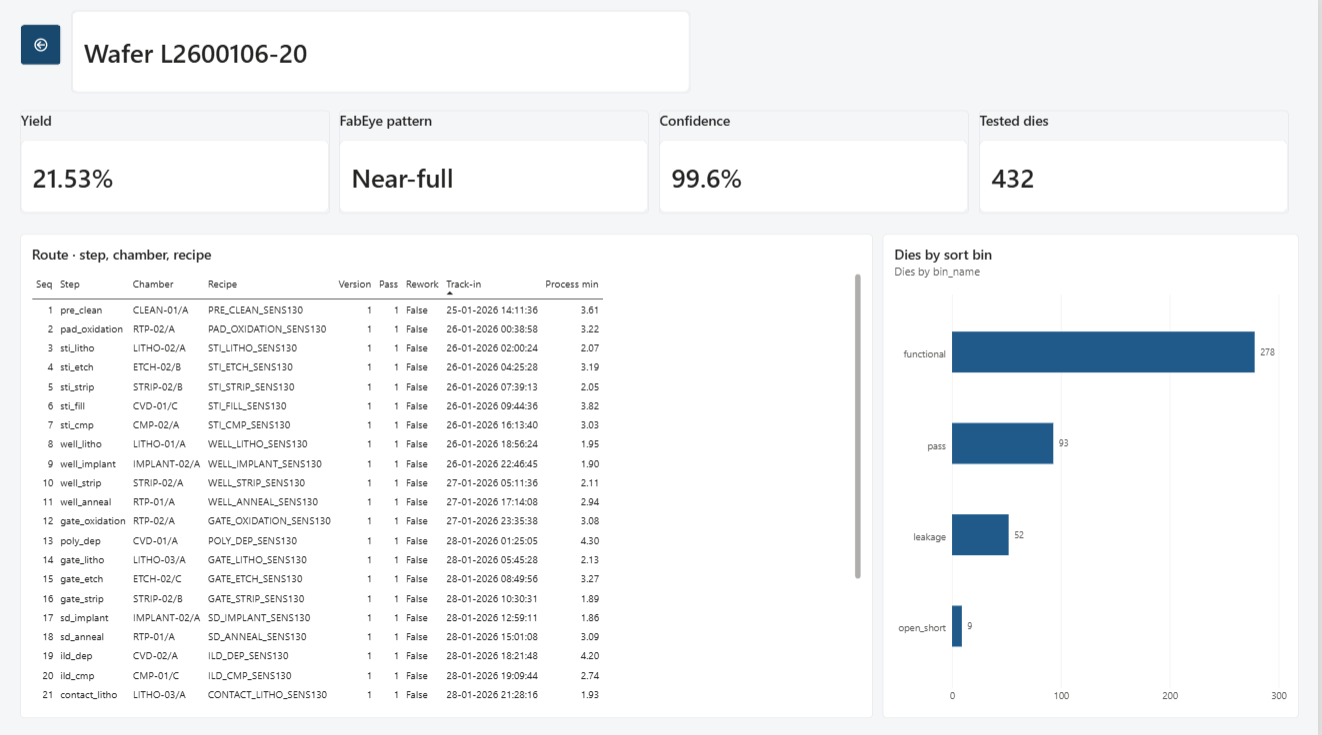
A semantic model on the dbt star schema (21 tables, 28 single-direction relationships, 39 DAX measures in display folders), saved as PBIP so every measure and page is a diffable text file in git. Five pages: an executive yield summary, a yield-loss Pareto, root cause, excursions and process control. Right-click a low-yield wafer to drill through to its route, chamber by chamber. The root-cause table puts each suspect's SPC alarms during the excursion next to its commonality rank, which shows where the two methods disagree: for one chamber offset, commonality ranked the true chamber 10th, while SPC had raised 3,740 alarms on it in the excursion window, against 428 on the top-ranked suspect. Row-level security limits each product engineer to their own product.
Engineering
- Reproducible: every number above comes from a
maketarget (make pipeline,make rootcause-report,make stream-demo, ...). - Decisions on record: twelve architecture decision records, from TimescaleDB over SQLite to exactly-once streaming through Postgres.
- Dashboards as code: generated from Python, drift-tested, and every query run in CI as the read-only role Grafana uses.
- Honest evaluation: time-ordered splits, chance baselines, rules fixed before looking at results, and negative results kept.
Usage
cp .env.example .env
make install            # uv environment + git hooks
make up                 # TimescaleDB, Grafana, MLflow, FabEye, Prometheus
make pipeline           # simulate, load, dbt, SPC, root cause, SECOM model (~16 min)
make fabeye-report      # classify every wafer map with FabEye
make stream-demo        # real-time SPC: replay a day, inject a drift
Grafana runs at localhost:3000, MLflow at localhost:5000.
Limitations
- Simulated fab: the excursion physics are simple and stated in the repo; real fabs are messier. SECOM is the real-data check, and it is a sobering one.
- Small evaluation sets: 40 injected excursions, 26 SECOM holdout fails; intervals are wide.
- Power BI runs in Power BI Desktop against the local warehouse (Import mode); it isn't published to the Power BI service.